Automate where it matters with process maps.
A 6 minute read, written by Mike Carter on 16 July 2019.
We've experienced how competing stakeholders, unclear ROIs, and uncertainty can make committing to business automation difficult. Process maps provide a powerful way to clear the fog.
Surprisingly, most businesses map their processes using mental models. These form automatically among employees as they do their work, and over time everyone comes to a rough agreement on how things fit together.
Unfortunately, mental models are often inaccurate and ego-centric. Through no fault of their own, people tend to over-emphasise their role in the operation of the business, and inaccurately represent the role of others.
The biased nature of mental models makes it difficult for stakeholders to agree where to invest in improving their business' operation. Everyone fights for what's most important as they see it, but not as it actually is. Additionally, forming shared mental models from this position is very time consuming; they need regular reinforcement among stakeholders to ensure they are maintained and understood.
Instead of invisible mental process models, we need to make processes visible.
Process mapsPermalink
A process map provides visibility. It is a diagram that shows the activiites involved in a process, and how they relate to one another. In business terms, the process may be the entire operation, or some part of it.
Process maps have nodes for inputs, activities, and outputs. Lines connect the nodes, showing how each part of the process feeds into others, and the numbers of occurences of each input, activity, or output are displayed at each node.
Process maps provide a fantastic method for making processes visible. They allow stakeholders to easily form a single shared understanding of a business' operation, and provide a concrete point of reference for decision making.
Below is a rudimentary example of a process map for an imaginary e-commerce site is selling shoes.
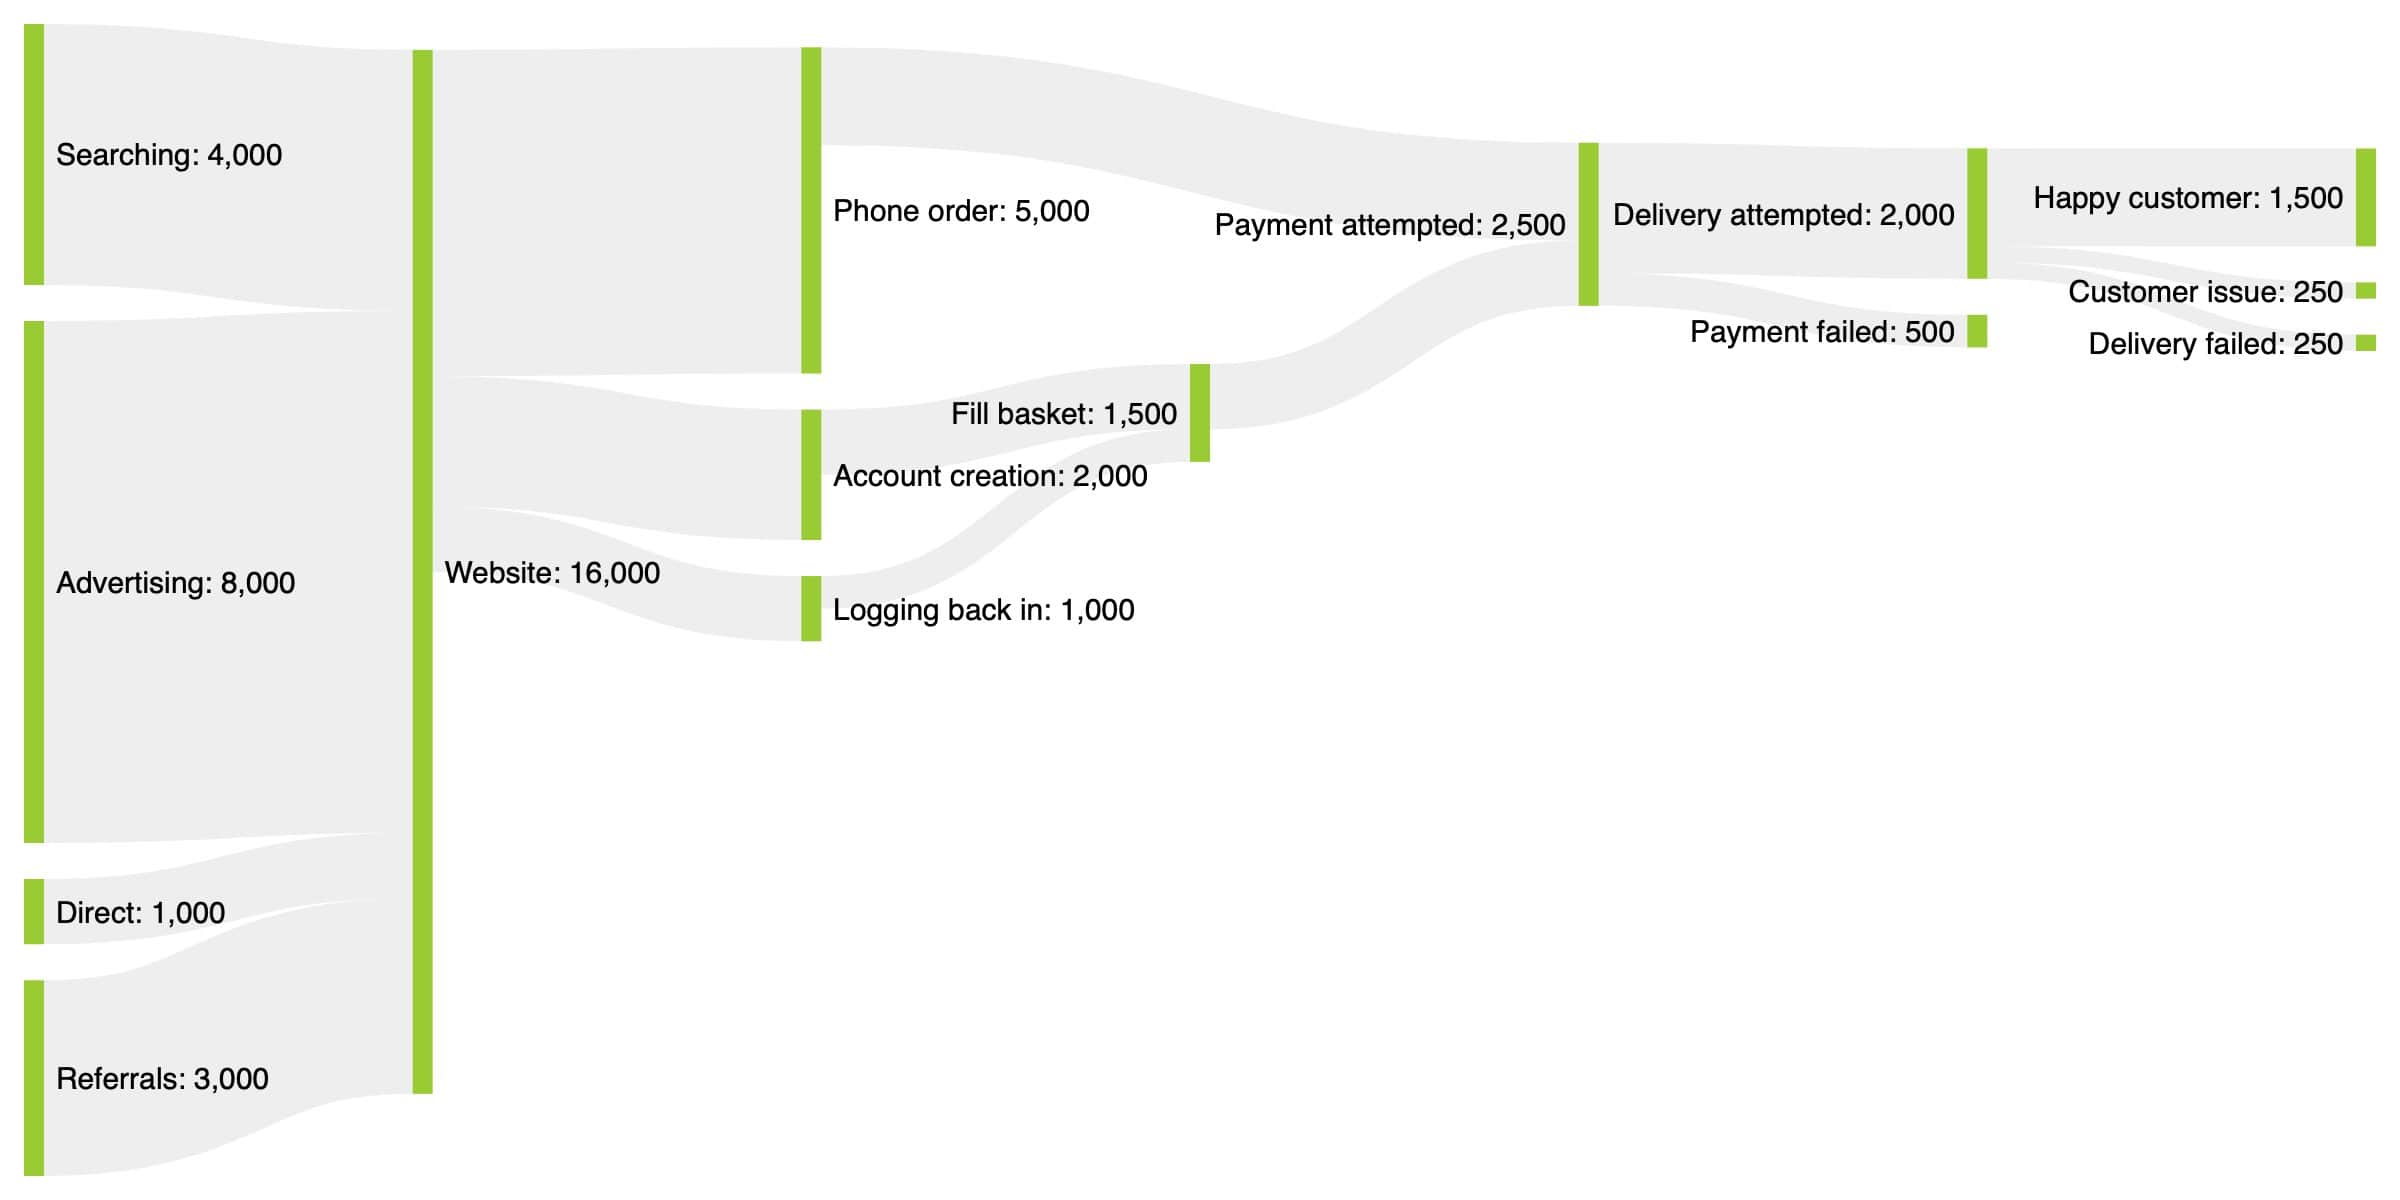
From this rudimentary example, you can easily see:
- The website gets 16,000 visitors a day from different sources.
- Most of those visitors drop out after landing on the website.
- Those which don't either phone, log in, or register.
- More drop out after this, only 2,500 a day place an order.
- Many orders suffer from payment failure, delivery failure, or a customer issue.
- About 1,500 customers receive successful deliveries per day.
The beauty here is that the numbers don't need to be completely accurate in order for the map to be useful. We can work effectively with good guesses because we're analysing trends at a high level, not sweating the detail when we don't have it.
However, should we get the detail, it could be added in the form of more nodes to get a more granular view of the business. For example, we may wish to dig into:
- Where the leads who drop out from the website go.
- What happens to those who ring the call centre but never make a payment.
- What are the reasons for payments failing, and what those customers do next.
- What human activities happen between payment being accepted and the shoes being sent for delivery.
These could be added by just building upon what's already included in the process map, without making the map any harder to understand for stakeholders who don't need such detailed information.
Driving automationPermalink
Process maps are fantastic tools for businesses looking to drive performance, efficiency, and scaleability through automation. They allow us to quickly see where inefficiencies lie, and allow us to make good predictions about what would happen if we were to change things.
For example, looking at our example e-commerce organisation again, conventional wisdom might tell us that in order to increase purchases, we need to increase marketing spend on advertising to drive more leads to the site.
From the process diagram, however, we can see that lead numbers are not the whole picture. Half of the customers visiting the website drop out right away, and a further third end up on the phones, where they have a low chance of purchasing, and we need staff available to take incoming calls.
Following this logic, if we could keep the customers happy online, our process diagram tells us they'd be more likely to purchase, and would do so via a much cheaper channel.
Instead of simply increasing leads, we'd be much better off looking at why so many customers drop out from the website or resort to using the phone. We could then work to make it easier and more convenient for customers to carry on online.
A helpful workflowPermalink
As we work to add automation to our client's businesses at Leaf, we use process maps to help both ourselves and stakeholders achieve a shared understanding of their businesses, identify where improvements can be made, and where money is best invested to make the biggest positive impact. We follow this workflow:
- Build a process map - Sometimes this will be for the entire business, and sometimes a particular process within the business. As a general guideline, we aim for a map detailed enough that it accurately reflects 80% of the possible scenarios in the process we're trying to improve.
- Identify areas for improvement - With a map in place, we can begin to identify the main areas for improvement. Typically these are things that are time consuming or expensive to complete, cause a significant dropoff, or otherwise introduce some sort of bottleneck to efficiency.
- Create goals - Once we know where we want to improve, we can create S.M.A.R.T goals around these areas. Side note - we wrote a whole post on how to use goals effectively.
- Assign goals - At this point, we've got a list of goals we need to achieve in order to make the business process better. We assign each to a capable person or team to complete.
- Build and work backlogs - Teams and individuals build backlogs of work focussed on achieving their goal, and work through them.
- Repeat - Once the goals have been achieved (or failed to be achieved), we update our process map to reflect the impact of the changes and repeat the process.
With this workflow, we're systematically rooting out inefficiencies, figuring out where we can have the biggest positive impact, using our knowledge of the numbers to set realistic goals, and building up focussed roadmaps around those goals to give stakeholders confidence in the value being delivered.
This is effective because work is driven from a solid shared understanding of the business, and a shared agreement about how where best to focus energy on improving things. If necessary, we can correct our course after each iteration of the workflow. This guarantees continued focus and improvement in the right areas.
At the end of the day, using this process map workflow helps to ensure a good return on investment for our clients. So, if you're struggling to get everyone on the same page about where to focus their energy, or aren't clear on the value being delivered by your development and automation efforts, give it a try.